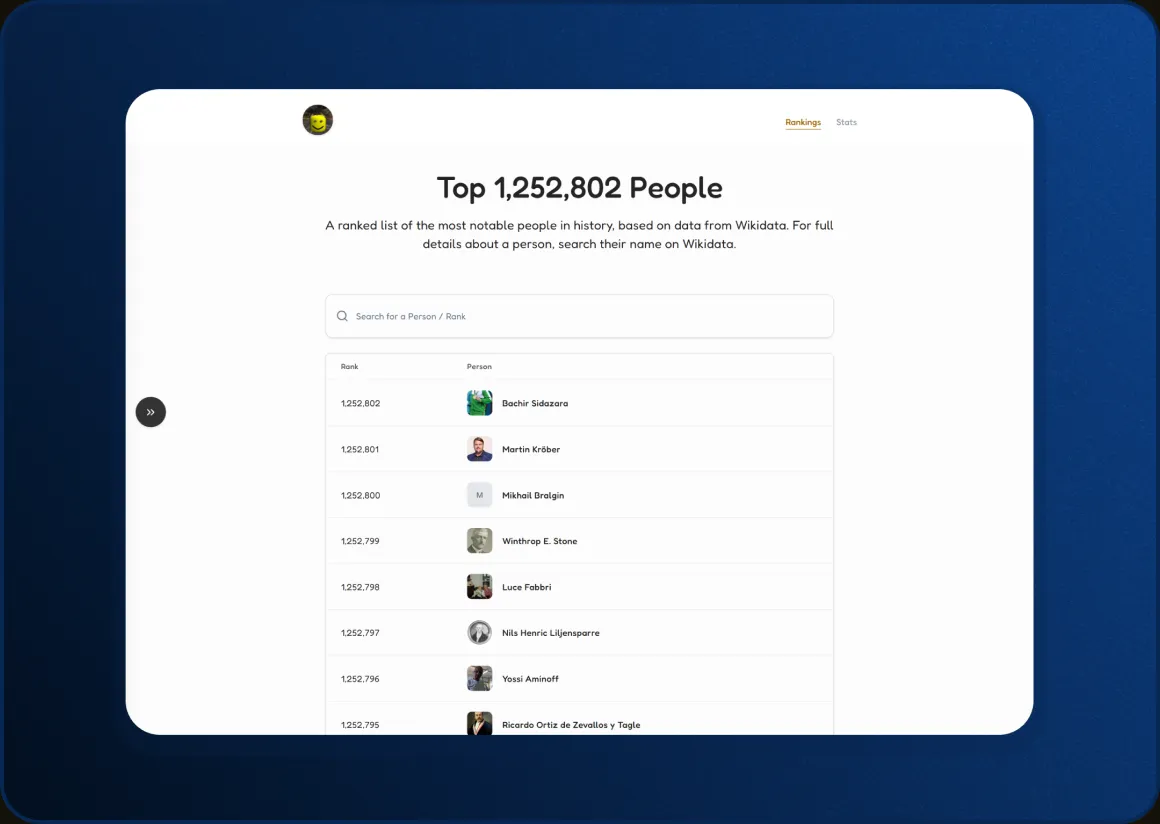
Top 1,252,802 People
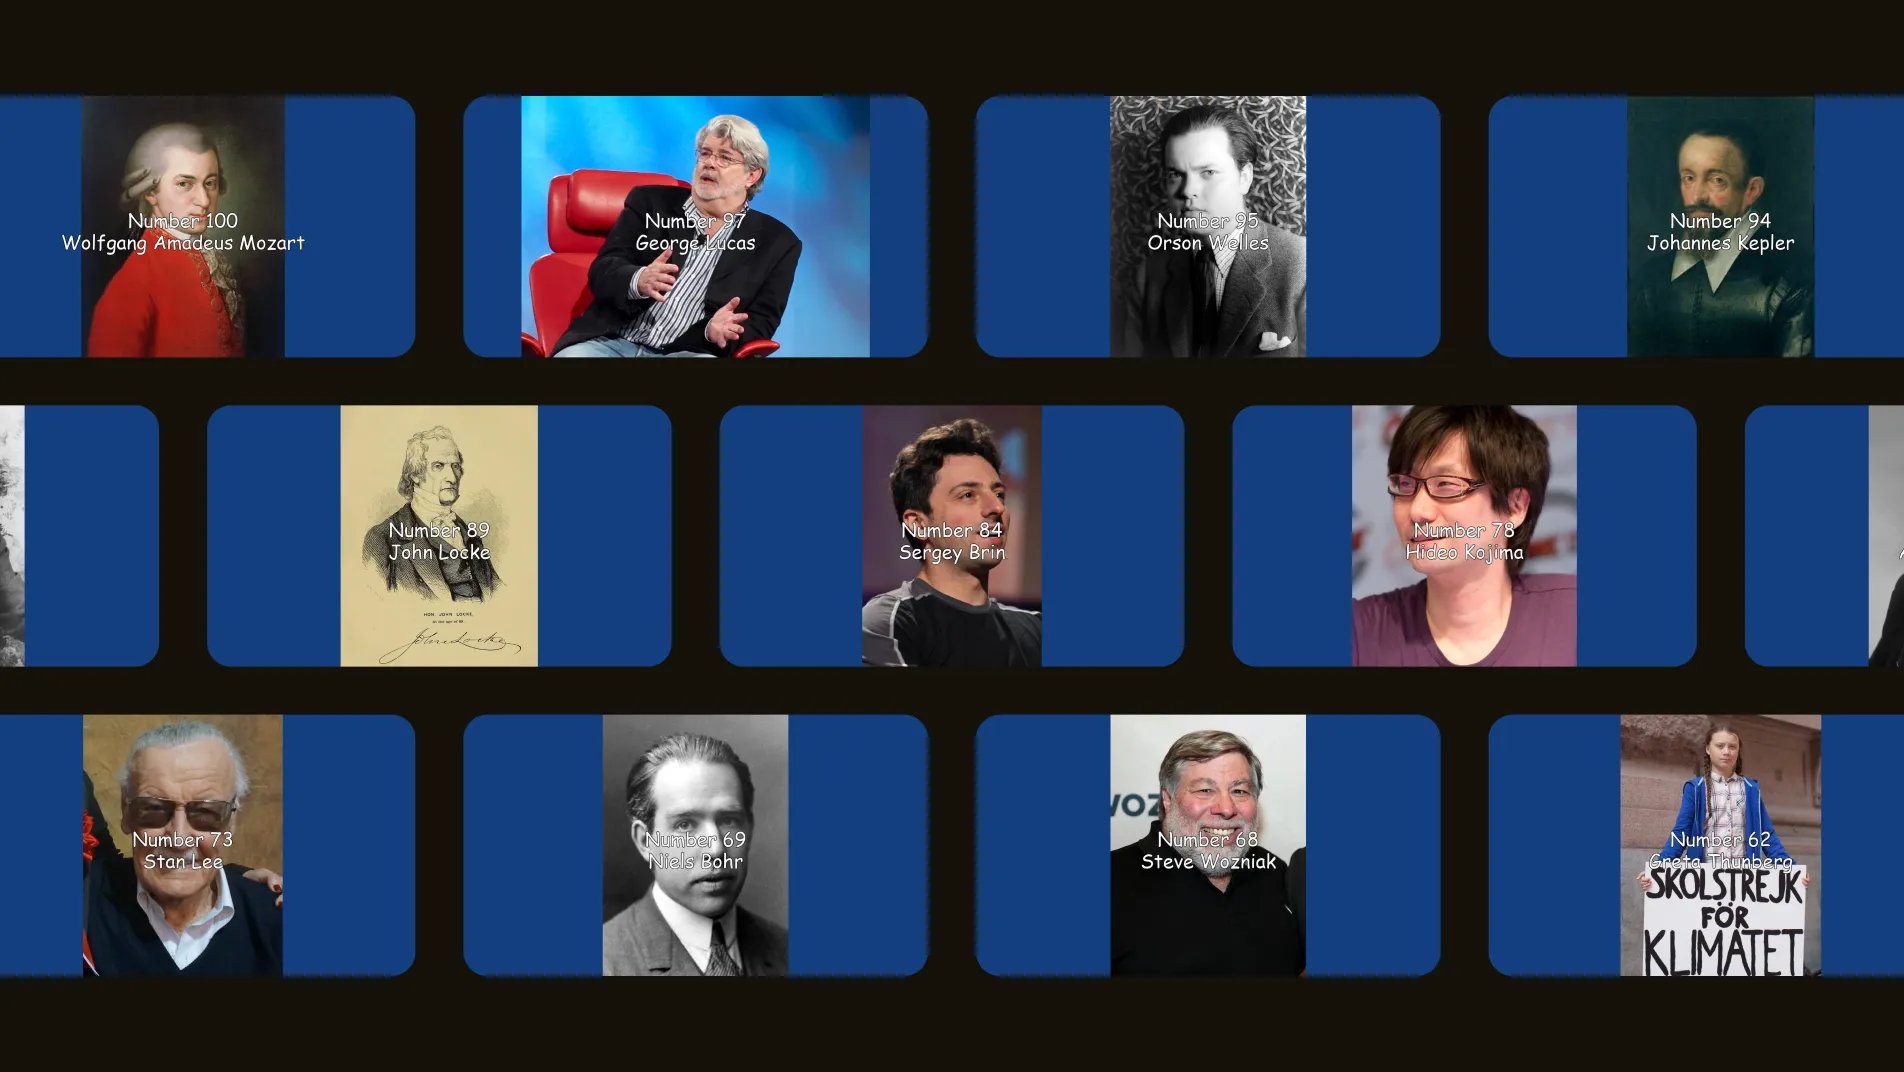
Designed and developed a 24/7 Livestream that ranked over 1.25 million notable people
Designed and developed a 24/7 Livestream that ranked over 1.25 million notable people. Outcomes include a 58 days continuous stream, 2.8k peak concurrent viewers, and 70.1k hours watched.

Concept & Idea
The project was inspired by long-form, humorous rankings such as “Top 5000 Cheese” and “Top 1,025 Pokémon” — lists that are intentionally excessive, playful, and almost absurd in scale.
This sparked a more ambitious question:
What would it look like to create an extremely long ranking that is not just funny — but structured, transparent, and grounded in real data?
Instead of inventing fictional entries or subjective opinions, I wanted to anchor the project in something verifiable and ethically sourced. After researching large-scale public datasets, Wikidata emerged as the ideal foundation. It provides structured, openly accessible information about notable individuals across history, without raising privacy concerns.
Originally, this was conceived as a static ranking video. However, the sheer length of the list changed the direction entirely. Presenting over a million entries as a video wouldn't be possible to be uploaded at all.
Instead, the project evolved into a 24/7 continuous livestream— transforming the ranking into a slow, unfolding experience where time itself becomes part of the design.
System Overview
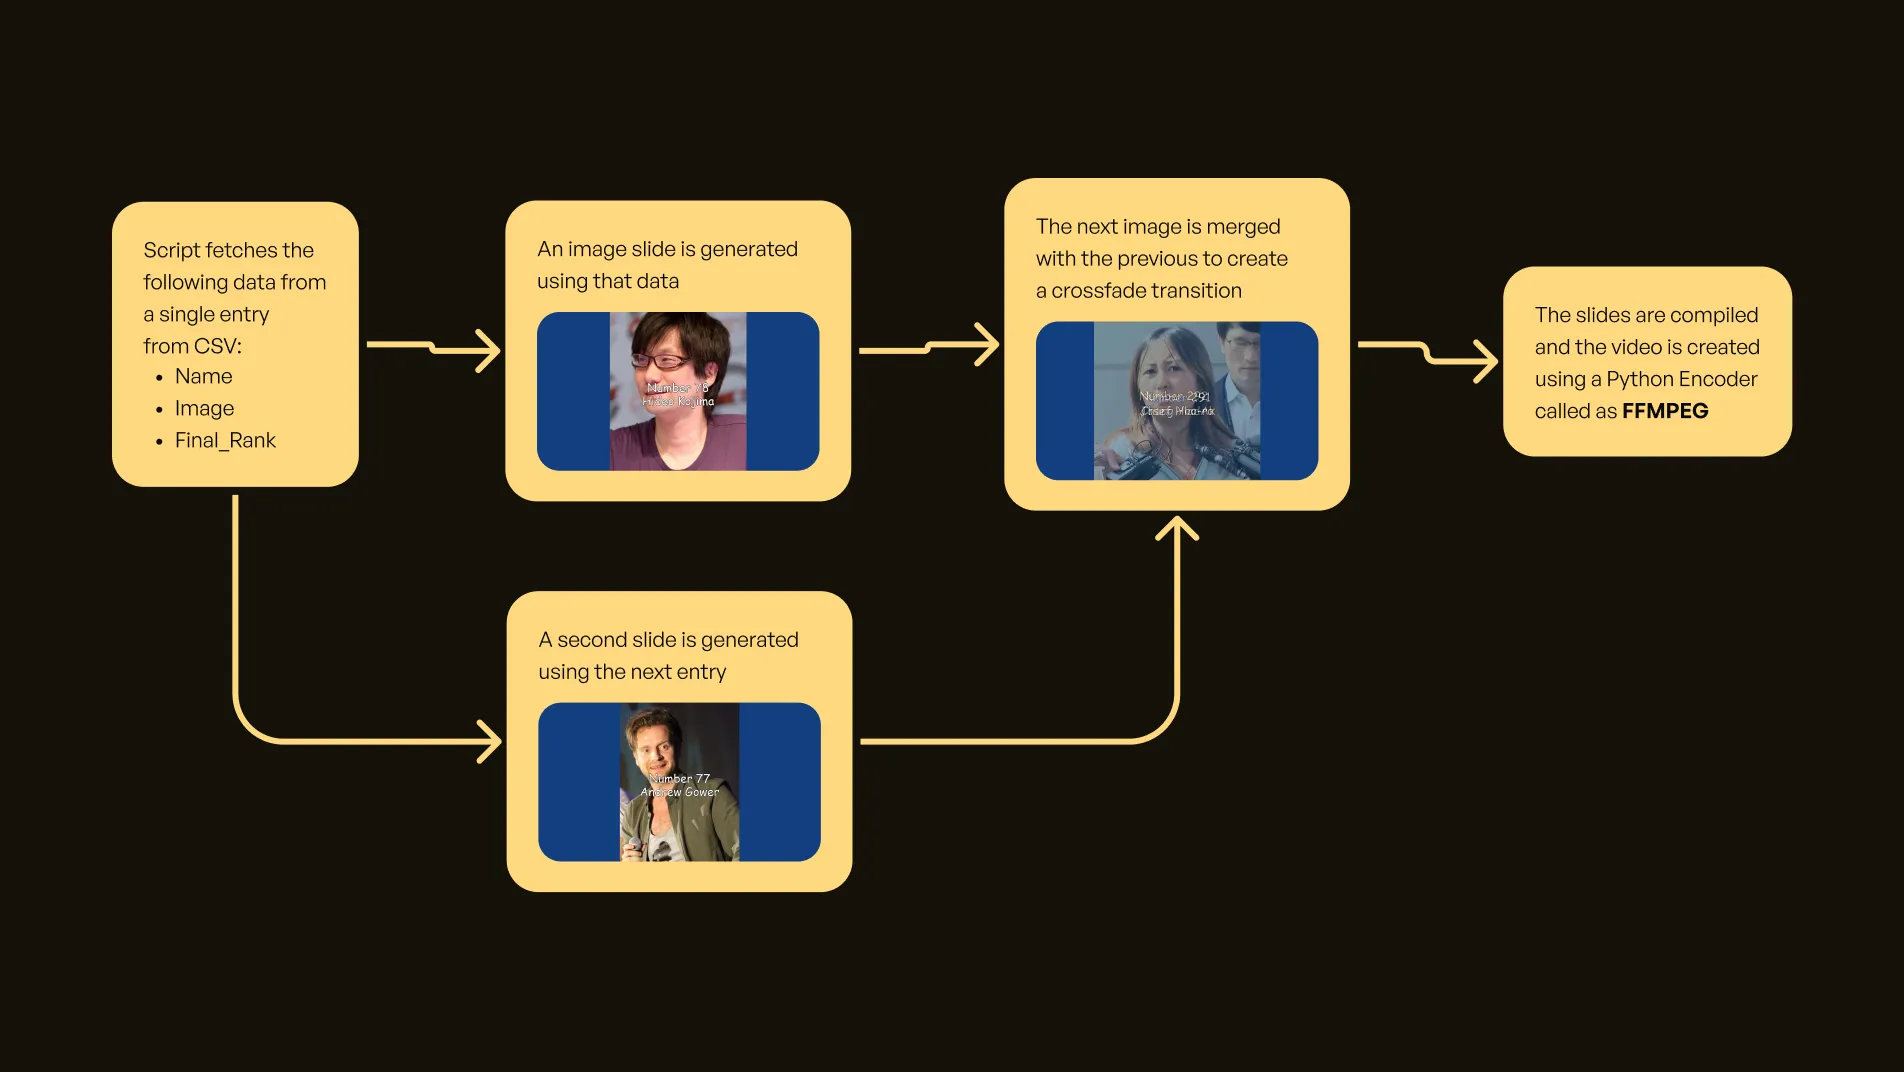
For this project, we had to make a coordinated system made up of data, automation, rendering and distribution layers.
Data Layer
The foundation of this project is structured public data from Wikidata.
- Large dataset of notable individuals
- Filtered for completeness and relevance
- Reduced to 1,252,802 valid entries
- Randomly sorted with Top 100 being manually sorted
Every layer later on, including the slide, rank and visual output depends on the structured base
Rendering Layer
Each slide is generated dynamically using:
- Name
- Rank
- Image
Slides are stitched together using automated video generation. Each slide runs for a fixed duration with a subtle crossfade transitions.
The design had to remain stable across a million iterations without visual fatigue.
Streaming Layer
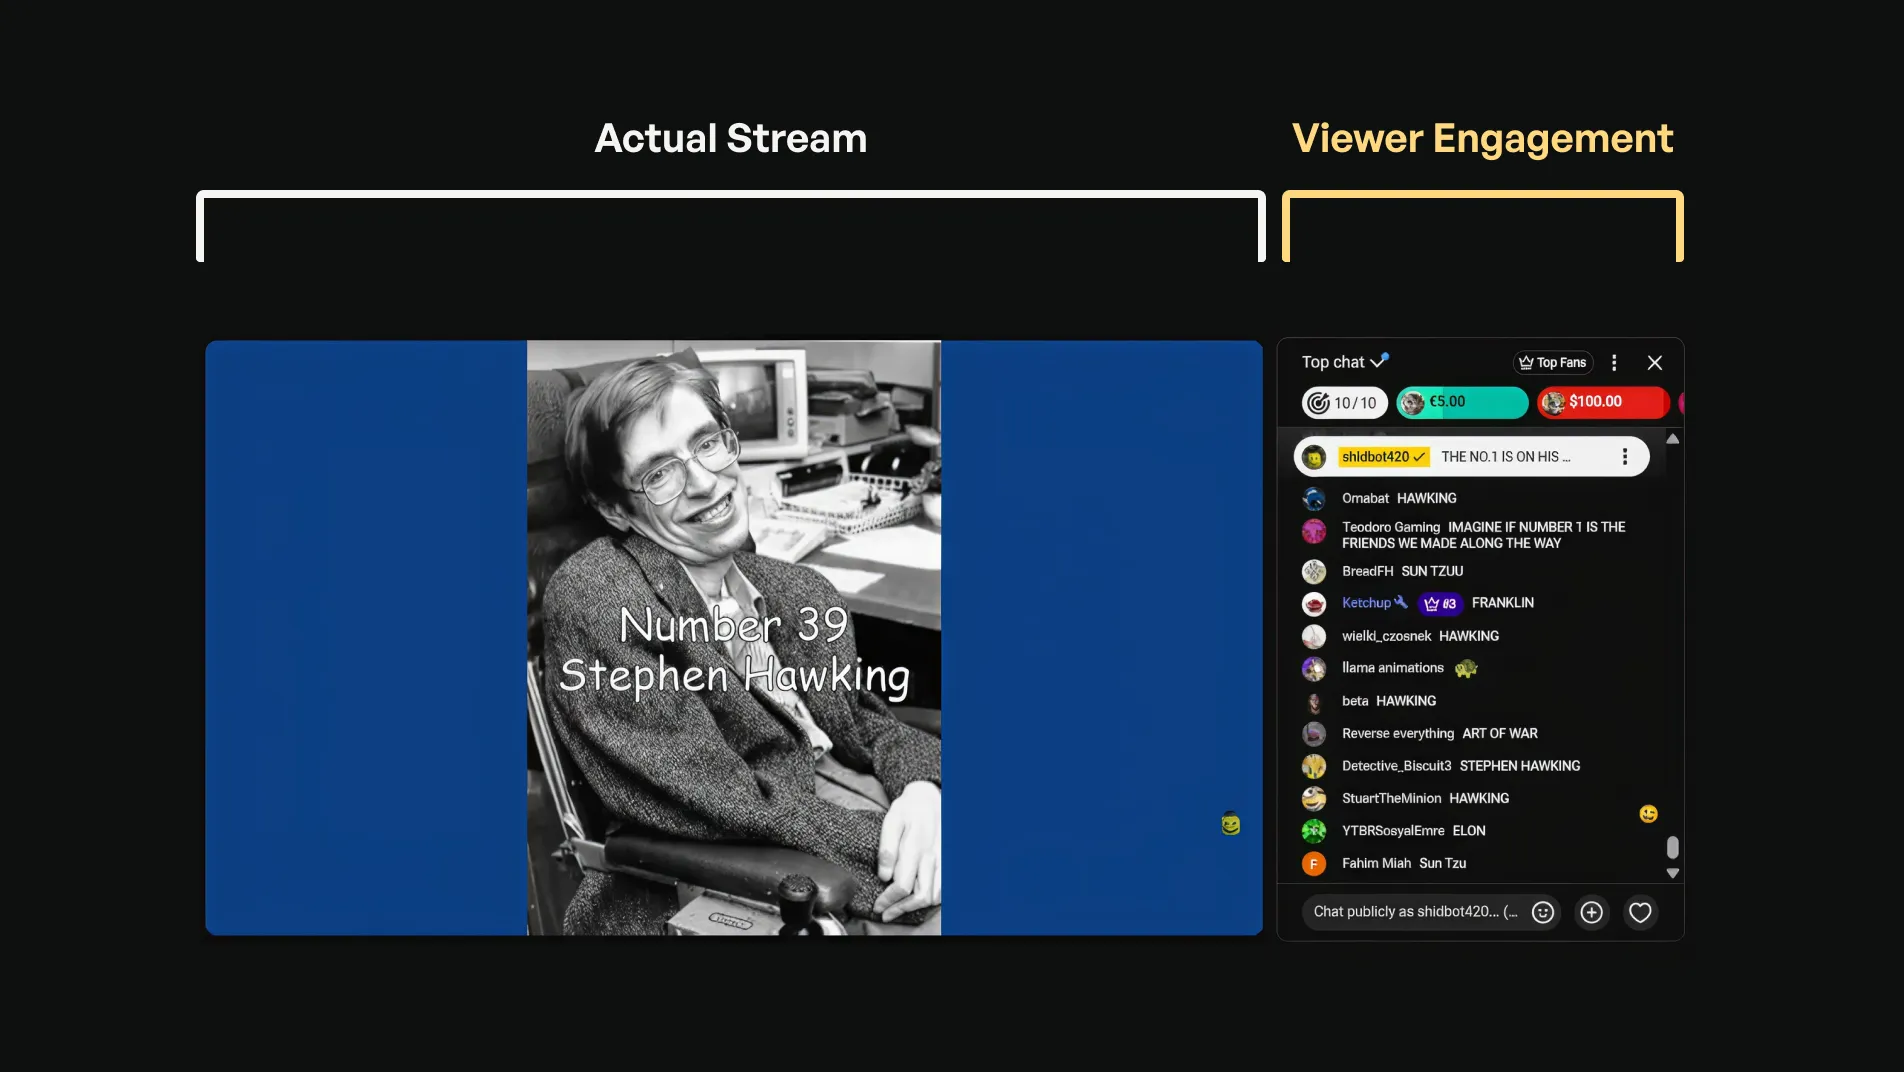
Instead of exporting a single long video file, the output is streamed live 24/7.
This approach:
- Avoids storage limitations
- Embraces the extreme duration
- Allows real-time audience engagement
- Turns the ranking into an ongoing event
The livestream becomes both the interface and the distribution channel.
UX & Psychological Principles in Usage
Ephemeral Experience Design
As a continuous 24/7 livestream, the experience is time-bound. Viewers engage with what is happening now, rather than navigating backward or replaying past segments.
This creates presence and shared real-time participation, similar to live events rather than static media.
Goal Gradient Effect
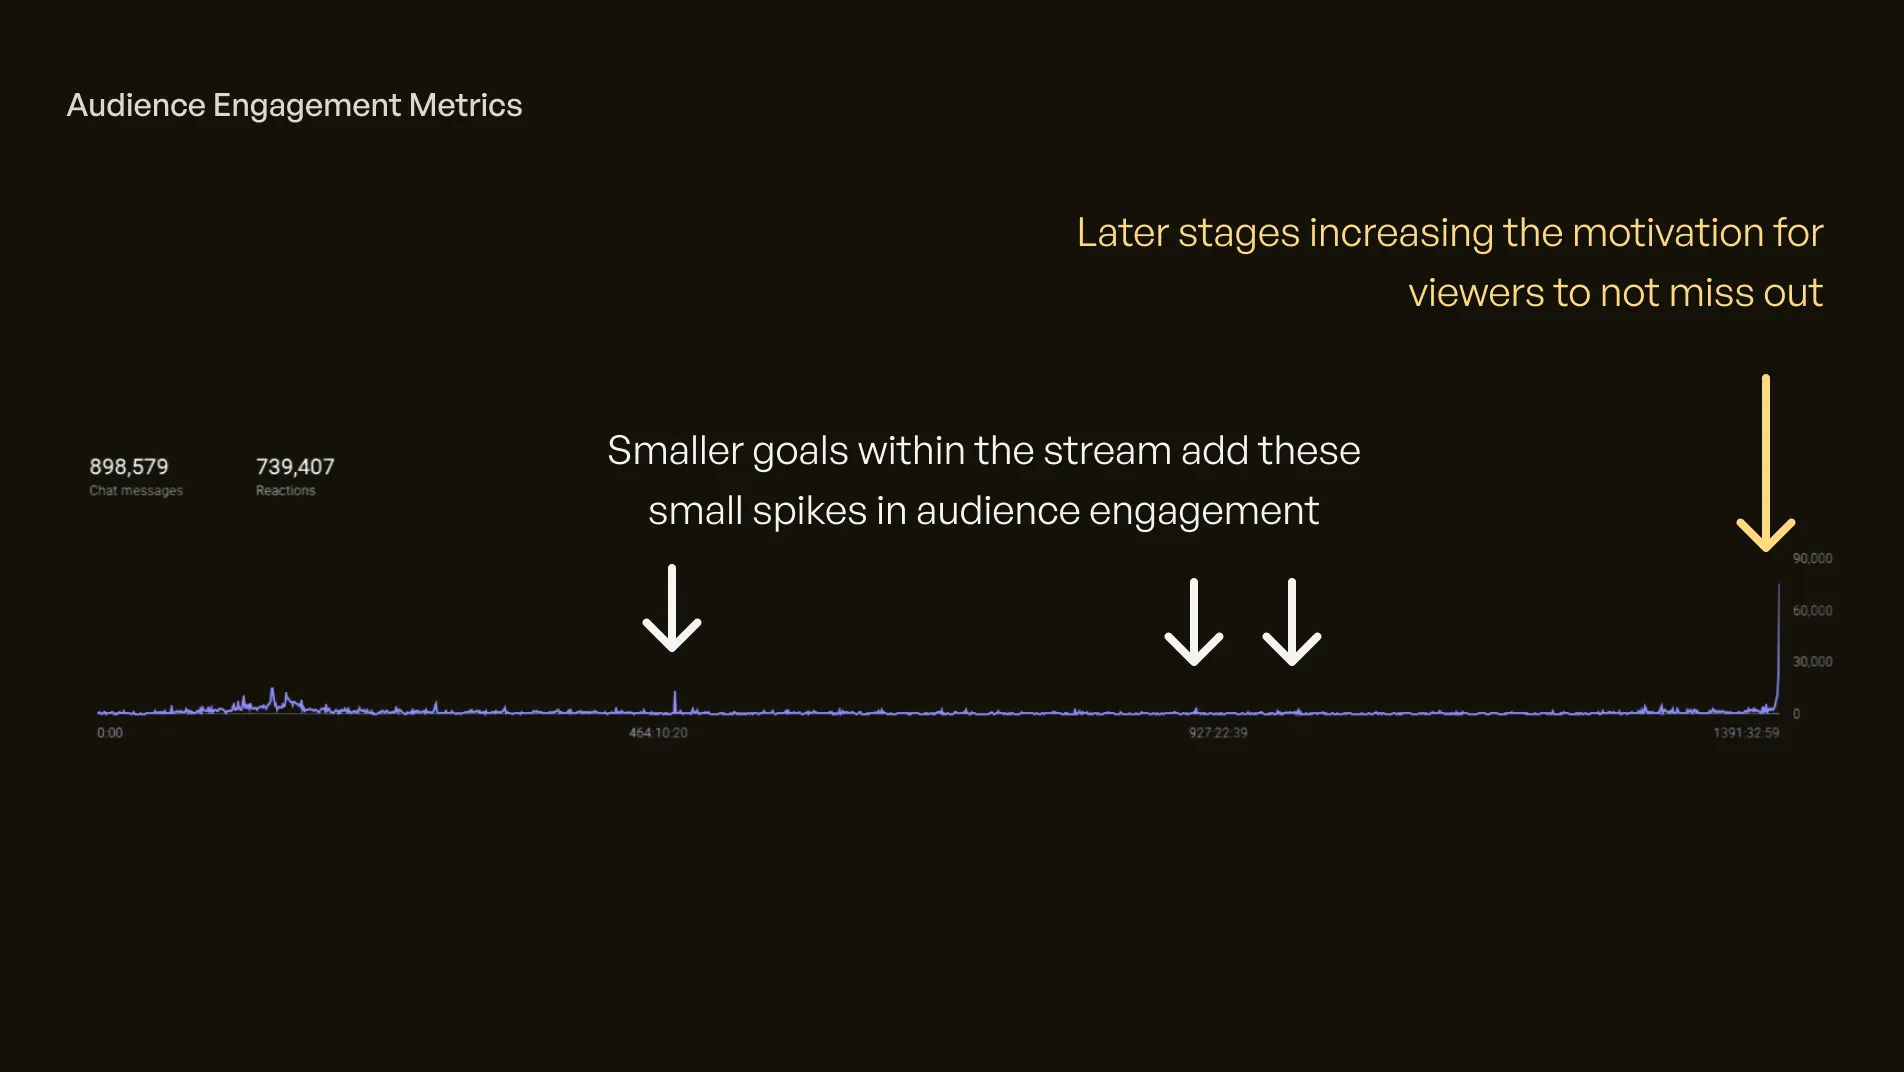
As the ranking approaches major milestones (e.g., Top 100, Top 10), engagement tends to increase. Behavioral research shows that motivation rises as people perceive themselves closer to a goal.
The descending structure intentionally supports this sense of momentum.
Progressive Disclosure Through Time
Instead of presenting all information at once, the ranking unfolds gradually. Time becomes the interaction model.
The slow, descending reveal builds anticipation naturally while keeping the experience lightweight and ambient.
Aesthetic and Minimalist Design
Only essential information is displayed: name, rank, and image. Removing secondary metadata reduces cognitive load and visual fatigue, which is critical for a stream designed to run for weeks.
The simplicity allows the content — not the interface — to remain the focus.
Website Experience (Companion product)
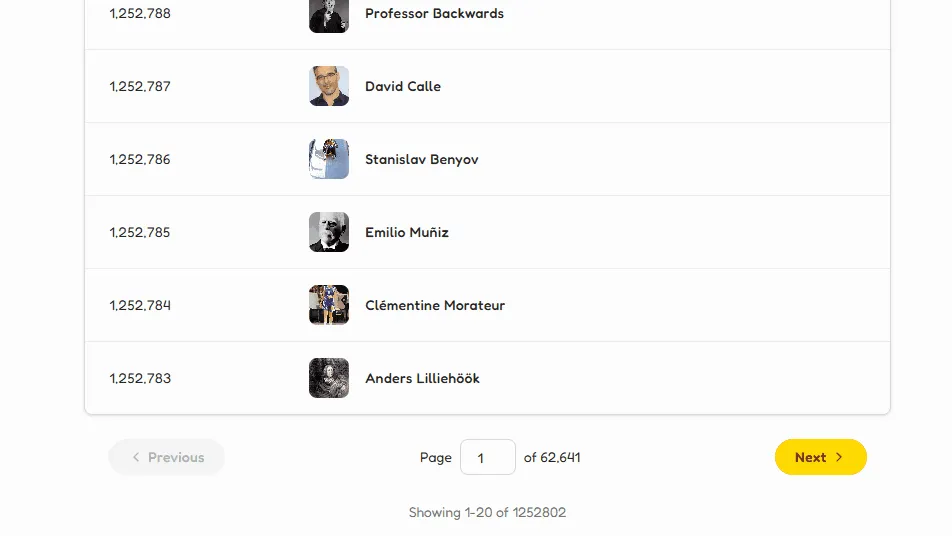
While the stream provided the narrative experience of 58 days long stream, a website was also developed to serve as an archive for these streams. The website is supposed to provide structure and exploration for the audience after the stream ends.
Search & Direct Access
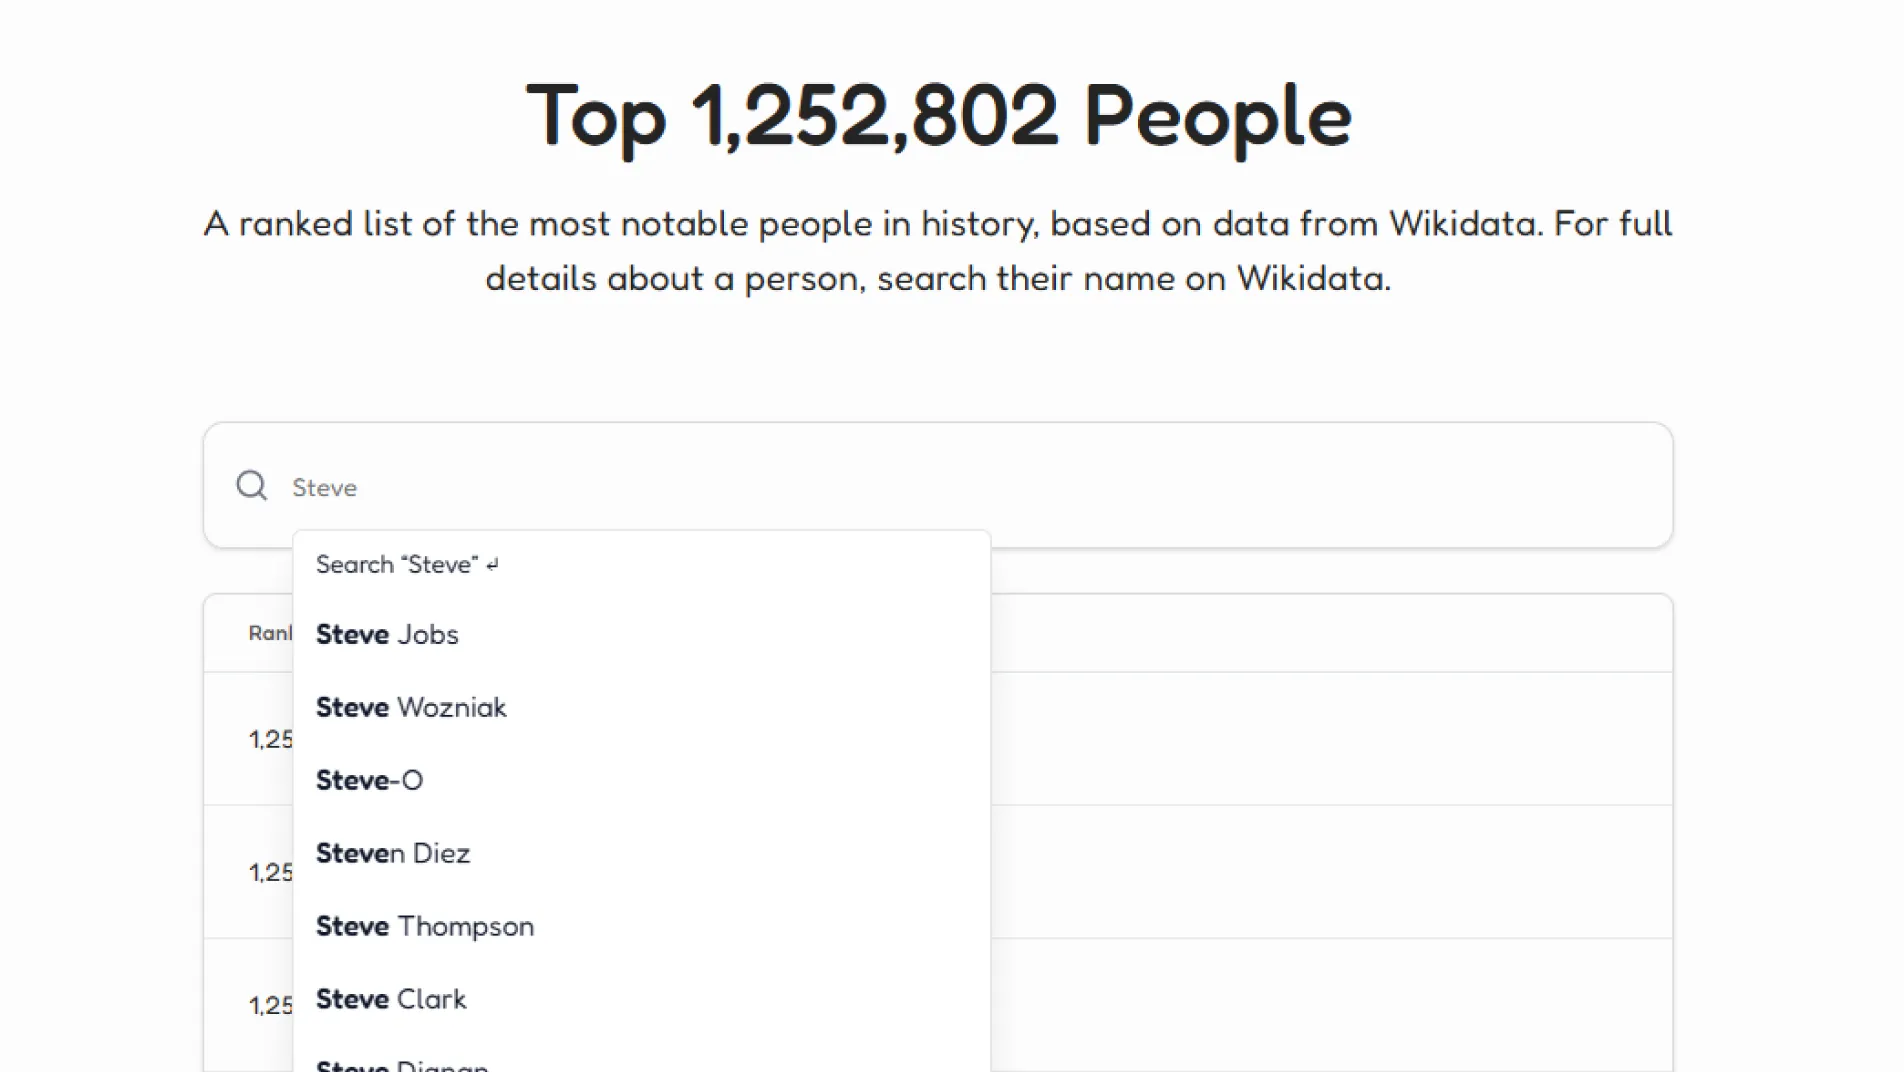
In the stream, users cannot jump to a specific person. The website allows direct search by name and rank to provide an immediate access to an individual.
Performance-First Design
Large datasets can cause slow load times and heavy queries. Progressive data loading, image fallback handling, lightweight UI structure and query optimization were used to prioritize speed over feature density.
Complementary Role to the Stream
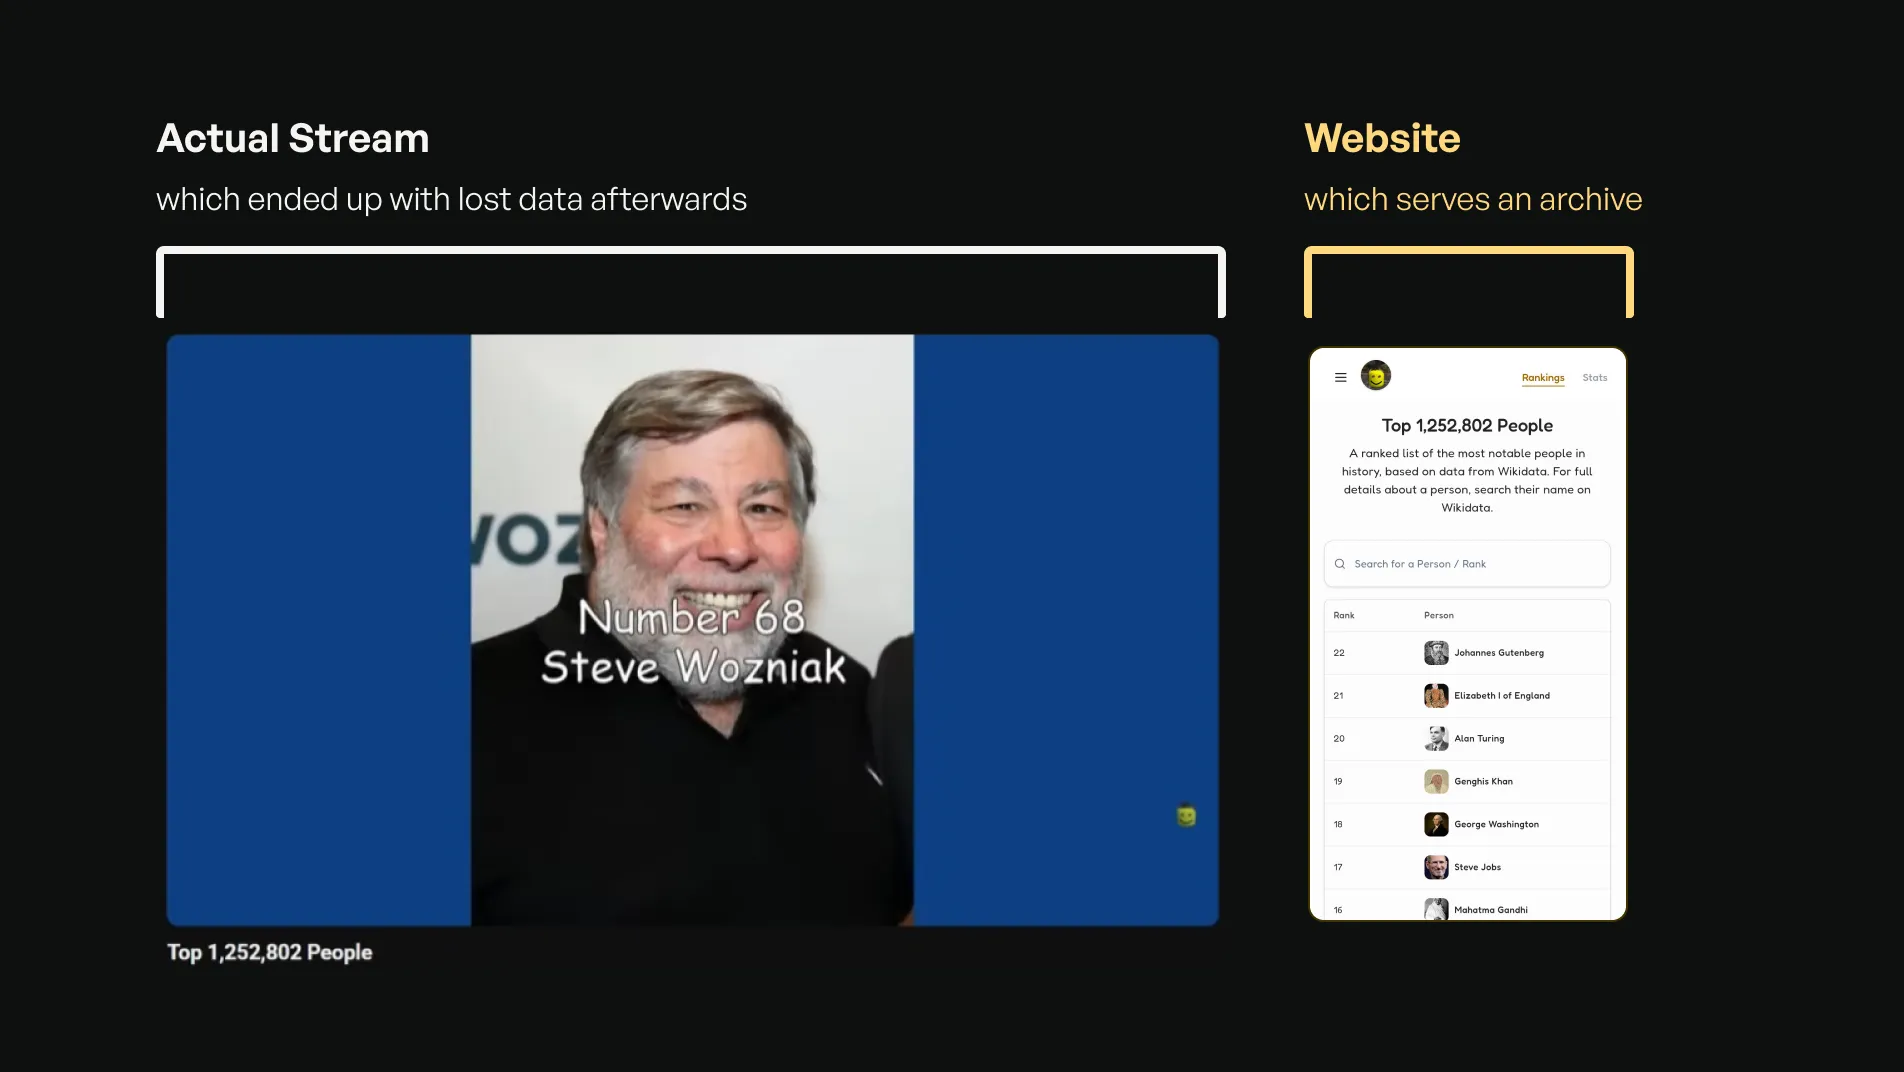
The livestream creates anticipation and shared experience, whereas the website provides an archival of the lost media state of the stream. Neither replaces the other, and each serves different user needs within the same ecosystem.
Outcomes & Impact
The project moved beyond a technical experiment and became a live product experience. Following metrics reflect its scale, stability and early user engagement.
58 Days
continuous stream
2.8k
peak concurrent viewers
70.1k
hours watched
18k
active website users in the first 3 days
These results validate the core design decision: simplicity, scale, and time-based progression can create meaningful engagement when executed with systems thinking.
What I Learned

Designing for Time is different from Designing for Screens
Most products are spatial, as users navigate through layouts. This project was temporal, as users move through time. I learned that pacing, repetition, and anticipation can function as primary UX tools when interaction is minimal

Systems thinking is a UX skill
Performance, automation, fallback logics and platform limitations can direct affect user experience. Design decisions cannot be separated from technical constraints, especially at extreme scale. This project strengthened my ability to think beyond interfaces and design at the system level.

Simplicity Scales Better Than Features
At 1.25 million iterations, small visual inconsistencies compound. As the more elements are added, the system can become more fragile. Prioritizing clarity and restraint was able to make the experience more stable and understandable.
What's Next
Top 1,252,802 People was designed as a scalable framework, not a standalone project. The same time-based, data-driven system can be extended into new domains with minimal structural changes. With each of the following streams, the overall structure and system have been improved:
- Earth Lore — 4.5M Years: A chronological journey through major events across 4.5 million years of Earth's history.
- Top 283,462 Fictional Characters: A large-scale ranking of characters across literature, games, film, and animation.
- Live Dictionary — A to Z: A continuous stream presenting 1.2M words in the English language in alphabetical order.
- Top 329,888 Canon Events: A structured ranking of notable events of Earth's history
- Top 338,667 Video Games: A descending ranking of video games across platforms and eras.
- Top 1,042,069 Movies: A ranking of movies across different eras
- Eternal Peace being Randomly Broken by Cursed Sound Effects: A lo-fi background music playlist being randomly broken by both default and user-added sound effects at any given point in the stream
The long-term goal is to evolve this into a family of persistent, data-driven livestream experiences, while keeping them fresh with newer ideas and unique experiences.